

Knock ‘Em Downs, headwhipping, and more: a quick guide to simple data collection with Google Forms
Ran here! Today I’m thrilled to talk about data collection. At the Dog Behavior Institute, we always begin our behavior assessments by getting a good sense of exactly where we are.
For example, it might feel like your dog is barking all the time at people passing by the house - and when you start tracking it, maybe you find that it’s only 3 times a day; or perhaps it’s actually 30 times a day. Or perhaps you notice that your dog has been shaking her head lately, and you want to have a sense of how often it’s happening - and you quickly realize it’s happening every 1-2 minutes, which might prompt a call to the vet. We have an entire (free!) webinar on data collection so I won’t regale you with all of the ways and reasons we do it, but I do want to offer some guidance on a simple way to collect some data and start getting a sense of what might be going on.
“Start by deciding what it is you want to know. What question are you trying to answer? Perhaps there are a lot of questions - so what is the one that is rising to the top for you? ”
There are a ton of apps and computer programs out there that can help you get a detailed picture of multiple behaviors at the same time, but we can often start by just looking at one or two things, and for that, we have Google Forms! Today I’ll walk you through how we use Google Forms for collecting frequency data (essentially a count of the behavior), but we can also use these forms to collect Antecedent Behavior Consequence (ABC) data and more!
Start by deciding what it is you want to know. What question are you trying to answer? Perhaps there are a lot of questions - so what is the one that is rising to the top for you? Once you know what you’re hoping to track, you can head on over to Google Forms and create a new form.

I, Ran, have a cat named Twig Notaro who regularly plays what we call “Knock ‘Em Downs.” The rules of “Knock ‘Em Downs” are that you knock things over until someone comes and pays attention to you. You get points every time someone pays attention to you, as well as every time you smash something. Twig is absolutely winning this game, and my partner and I - and our wine glasses - are losing.
We already have sufficient information to identify that this is maintained by our attention, but it might also be helpful for us to have a good sense of what times of day Twig engages in Knock ‘Em Downs. If we can find a pattern, we can use that information to create an intervention that provides the functional reinforcer based on that timeframe. Additionally, we’ll already have baseline data, so we’ll be able to see if any intervention we implement is effective in reducing Knock ‘Em Downs. So here’s our Google Form with a title.
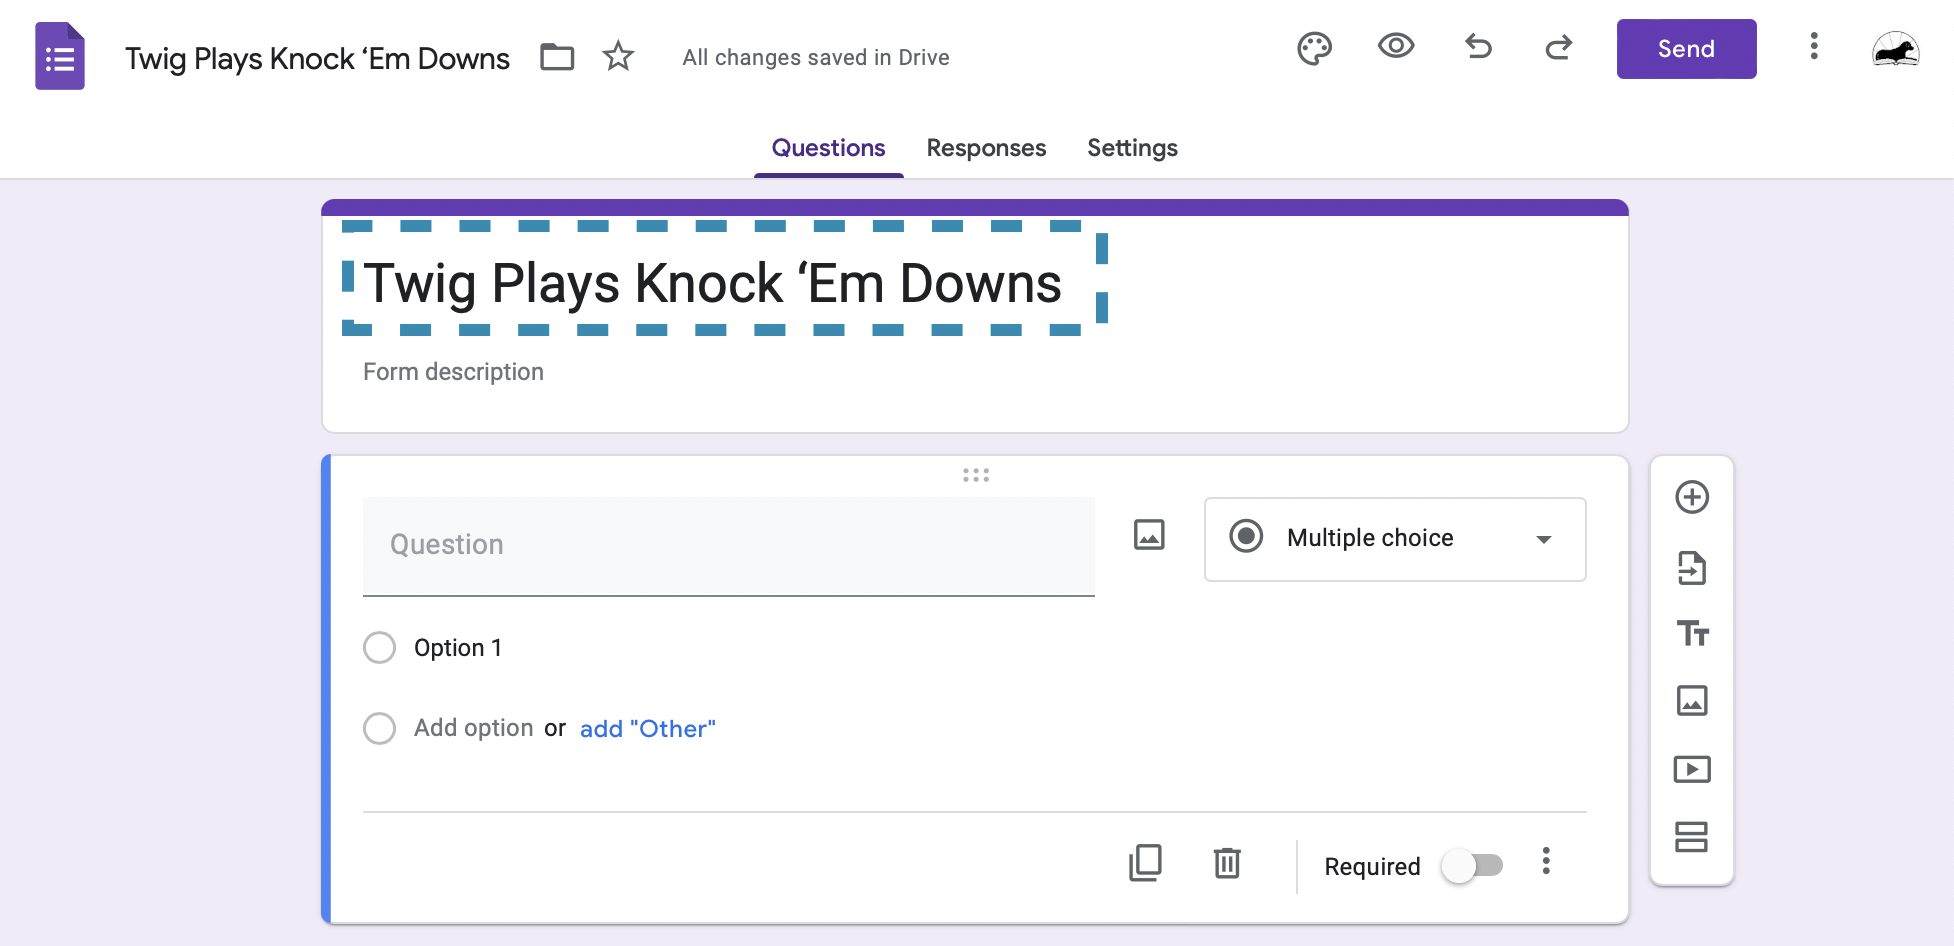
The next step is so easy that it almost feels like cheating. Just come up with the wording of your question and one answer. Yes - just one answer! We’re keeping it simple to start.

And that’s it! Then you have your form, ready to go. Click “Send” in the upper righthand corner and it will give you the link to the live form. Or click on the little eyeball to see what your data sheet looks like! Here’s mine:

Honestly, we haven’t started collecting data yet for Knock ‘Em Downs at my house, but we’re about to now that we have this data sheet! In the meantime, one thing we have been collecting data on is my dog Beacon’s head whipping. When she turns suddenly and stares at one of her hips for a moment, that can be an indicator of pain. A Google Form is how we’ve been tracking it, which we can then correlate with her exercise, pain meds, and other treatments. For Beacon, the data sheet is just a hair more complicated, because I’m looking at which hip she’s reacting to. Here’s Beacon’s data sheet on my phone:
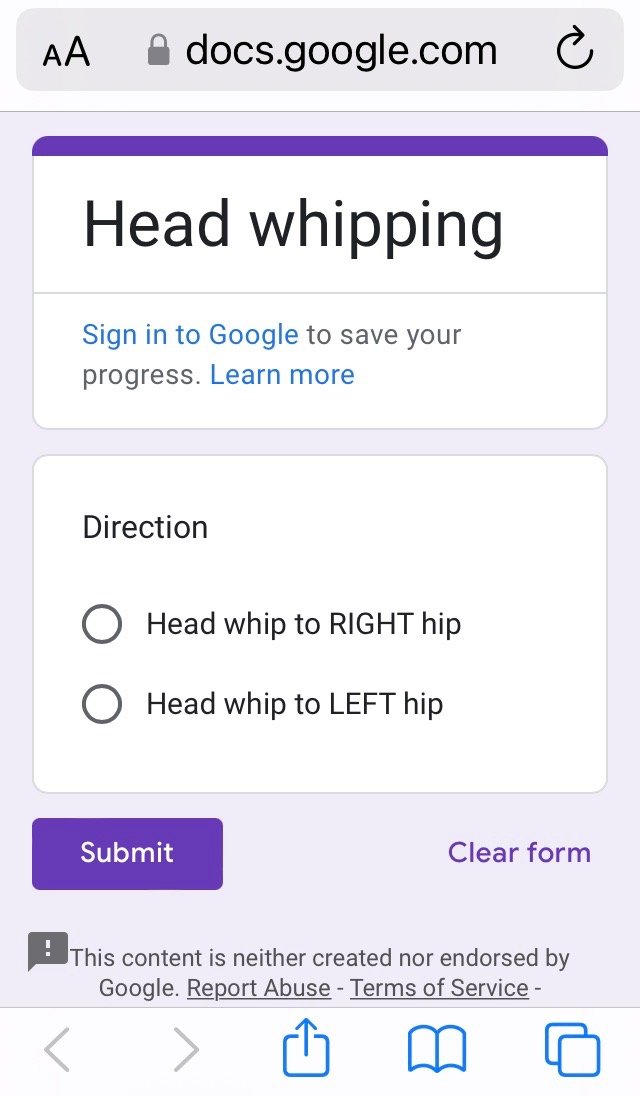
(A quick aside: if you’d like to learn more about how to put this on an iPhone for quick and easy access, click here for some simple instructions!)
When I go into the results on my computer, I can click “Responses” at the top of the page.

This then shows me a beautiful pie chart that indicates that she’s more reactive to her left than her right hip. This isn’t surprising at all - she has arthritis in her left hip only. But then I can click on the little spreadsheet icon in the upper right hand corner…

… and that shows me every single instance of the behavior over time. This information can then be analyzed to look at frequency, time of day, and other factors.

And this is where we come in! We can take your data and graph it to create a visual depiction of what might be happening. As mentioned earlier, we might be able to look at time of day, or compare changes to other factors. I consolidated this to look at head whips per week. It looks to me like Beacon feels better on the weeks she gets massages from Healing with Sam, and the data seem to support this!

“Data collection” can sound daunting, but it doesn’t have to be. This can be a simple way to start tracking what is happening on a regular basis. This information can then be used to ask more specific or relevant questions, or to start creating behavior plans!